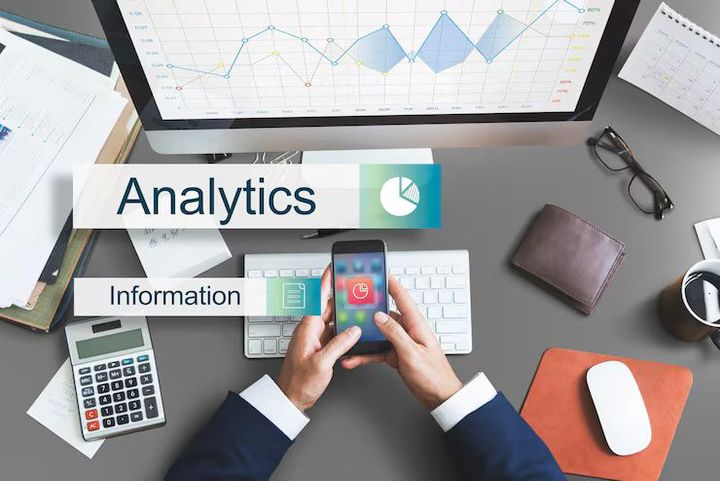
How a Data Analysis Tool Works: Features, Benefits, and Use Cases
Data is part of everyday life. From online shopping and weather forecasts to healthcare and education, information is collected every second. However, raw data on its own does not provide meaningful answers. It needs to be organized, examined, and interpreted before it becomes useful. This is where a data analysis tool plays an important role.
A data analysis tool helps people understand information by sorting, cleaning, and presenting data in an organized way. Whether someone is reviewing business reports, studying research results, tracking website visitors, or examining financial records, these tools make it easier to identify patterns and trends.
This guide explains what a data analysis tool is, how it works, common features, different types, practical applications, and important points to consider before choosing one.
What Is a Data Analysis Tool?
A data analysis tool is software designed to collect, organize, process, and visualize data. Instead of manually reviewing thousands of rows of information, users can quickly summarize results, compare values, and discover meaningful insights.
Many people associate data analysis only with large organizations, but these tools are useful for individuals, students, researchers, educators, healthcare professionals, and small organizations as well.
Some tools focus on spreadsheets, while others specialize in statistics, dashboards, reporting, or large datasets.
Why Data Analysis Matters
Every day, people make decisions based on information. Accurate analysis helps reduce confusion and supports more informed choices.
For example:
- A teacher may review student performance throughout the school year.
- A researcher may examine survey responses.
- A healthcare organization may study patient trends.
- A website owner may review visitor activity.
- A financial analyst may compare monthly spending patterns.
Without proper analysis, important details may remain hidden within large amounts of information.
How a Data Analysis Tool Works
Although different tools have different capabilities, most follow a similar process.
1. Collecting Data
Information can come from spreadsheets, databases, websites, surveys, applications, or other digital sources.
2. Cleaning Data
Real-world data often contains duplicate entries, missing values, formatting problems, or incorrect information. Cleaning improves accuracy before analysis begins.
3. Organizing Information
The tool arranges data into tables, categories, or structured formats that are easier to understand.
4. Analyzing Patterns
Using filters, calculations, statistical methods, or visual summaries, the tool identifies trends, relationships, and unusual changes.
5. Presenting Results
Results may appear as charts, graphs, dashboards, or reports that help readers understand the findings more easily.
Common Features of a Data Analysis Tool
Many modern tools include a combination of practical features.
Data Import
Users can import information from spreadsheets, databases, cloud storage, or CSV files.
Data Cleaning
Built-in functions help remove duplicates, correct formatting, and handle missing values.
Filtering and Sorting
Large datasets become easier to explore by arranging information according to selected criteria.
Charts and Graphs
Visual representations help explain information more clearly than long tables of numbers.
Common chart types include:
- Bar charts
- Pie charts
- Line graphs
- Scatter plots
- Histograms
Statistical Functions
Some tools include statistical calculations such as:
- Average
- Median
- Standard deviation
- Correlation
- Regression
- Trend analysis
Dashboards
Dashboards combine multiple charts and summaries into one screen, making ongoing monitoring simpler.
Reporting
Reports organize findings into structured documents that can be shared with others.
Types of Data Analysis Tools
Different tools are designed for different purposes.
Spreadsheet-Based Tools
Spreadsheet applications remain popular because they are familiar and suitable for small to medium datasets.
They allow users to:
- Create formulas
- Sort information
- Build charts
- Filter data
- Generate summaries
Statistical Analysis Software
Researchers and academic institutions often use statistical software for deeper mathematical analysis.
These applications support:
- Hypothesis testing
- Probability analysis
- Regression models
- Survey analysis
Business Intelligence Platforms
Business intelligence platforms combine data from multiple sources into dashboards and visual reports.
They help organizations monitor performance over time.
Database Analysis Tools
When working with very large datasets, database tools organize and retrieve information efficiently.
Programming-Based Analysis
Some professionals use programming languages for customized analysis and automation.
This approach provides flexibility when handling complex datasets.
Common Uses of Data Analysis Tools
These tools support many industries and everyday activities.
Education
Schools and universities analyze attendance records, examination results, and learning progress.
Healthcare
Medical researchers examine patient information, treatment outcomes, and public health trends.
Finance
Financial professionals review spending patterns, revenue changes, budgeting information, and investment performance.
Retail
Retail organizations study purchasing behavior, inventory levels, and seasonal demand.
Marketing
Marketing teams evaluate website traffic, campaign performance, and audience engagement.
Manufacturing
Manufacturing facilities monitor production output, quality measurements, and equipment performance.
Scientific Research
Researchers organize experimental data and compare findings from different studies.
Benefits of Using a Data Analysis Tool
A well-designed data analysis tool provides several practical advantages.
Saves Time
Automated calculations replace many repetitive manual tasks.
Improves Accuracy
Built-in formulas reduce the chance of calculation errors.
Makes Information Easier to Understand
Visual charts help readers interpret complex datasets more quickly.
Supports Better Planning
Historical trends provide useful context for future planning.
Handles Large Volumes of Data
Many tools process thousands or even millions of records efficiently.
Encourages Collaboration
Reports and dashboards allow multiple team members to review the same information consistently.
Important Factors When Choosing a Data Analysis Tool
Different users have different requirements. Several factors deserve attention during evaluation.
Ease of Use
Clear menus and simple navigation reduce the learning curve.
Data Compatibility
The tool should support common file formats and data sources.
Visualization Options
Multiple chart types improve communication of results.
Processing Performance
Large datasets require efficient processing without significant delays.
Security
Data protection features help safeguard sensitive information.
Reporting Capabilities
Exporting reports into common document formats improves sharing and record-keeping.
Scalability
As data grows over time, the tool should continue handling larger datasets effectively.
Common Challenges
Although data analysis tools simplify many tasks, users may still encounter challenges.
Poor Data Quality
Incomplete or incorrect information can affect results.
Learning New Features
Some advanced tools require practice before users become comfortable with all available functions.
Data Privacy
Organizations handling sensitive information must follow appropriate privacy practices.
Information Overload
Large dashboards with excessive charts can make interpretation more difficult instead of easier.
Tips for Effective Data Analysis
A few simple habits can improve analysis quality.
- Verify data before beginning analysis.
- Remove duplicate records.
- Keep consistent formatting.
- Select charts that match the data type.
- Review unusual values before concluding.
- Update datasets regularly.
- Document important calculations.
These practices improve accuracy and help maintain consistent reporting.
The Future of Data Analysis Tools
Technology continues to expand the capabilities of modern analysis software. Automation, machine learning, and artificial intelligence are helping users organize information more efficiently. Interactive dashboards, cloud-based collaboration, and real-time reporting are becoming increasingly common across many industries.
Despite these technological advances, the main purpose remains unchanged: transforming raw information into meaningful knowledge that supports informed decisions.
Conclusion
A data analysis tool helps transform large amounts of information into organized, understandable insights. By collecting, cleaning, analyzing, and presenting data, these tools simplify complex information and help users identify meaningful trends.
Whether used in education, healthcare, finance, research, manufacturing, or everyday reporting, data analysis tools make information easier to interpret and communicate. Understanding their features, applications, and practical considerations enables users to select a solution that fits their analytical needs while improving the overall quality of decision-making.